Hi all,
I’m facing unexpected edge-effects in a super simple 2D-Liquid-Flow simulation.
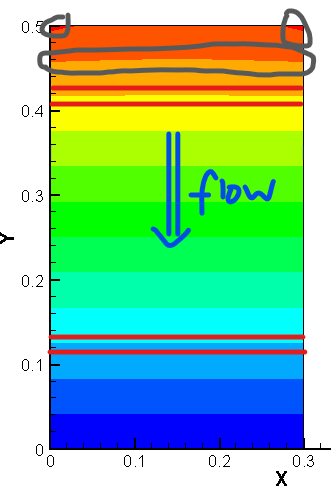
As you can see from the case attached, the 2D domain is 10 x 10 cm, 1mm structured grid, source term on the left edge, boundary condition on the right edge. The case should be very similar to the “H/sat_1D” benchmark and thus I expected a straight distribution from “some” pressure on the left to 0 Pa on the right side, but as you can see in the plot, the pressure distribution on the left side is not straight and on the right side the pressure drops to (almost) 0 about 0.9cm = 9 cells away from the boundary. Any ideas? OGS-Version 5.5.4
In case I get that running, I would like to model a heterogeneous sediment similar to the “H/HetGWFlow/2D” example. In this example, a permeability list is used. Is there a way to map these kind of lists from an ascii/excel/whatever file for more complicated geometries and unstructured meshes?
Finally, Is there a way to map boundary conditions from a file to a polyline or surface? If not, I guess “DIRECT” would work for me as well.
Best Regards!
Gerrit
hFTest7.rar (257 KB)
Hi Gerrit,
For your edge problem, because your mesh is too small (0.001*0.001). To solve this issue you can simply define the parameter “$EPSILON” in .gli file for both “left” and “right” POLYLINE. Please fine the modified .gli in attached file.
Cheers,
Wenjie
hFTest7.gli (445 Bytes)
···
发件人: [email protected] [mailto:[email protected]] 代表 Gerrit Laube
发送时间: 2014年12月2日 1:30
收件人: [email protected]
主题: [ogs-users] Large edge-effect in small-scale 2D Liquid-Flow Scenario
Hi all,
I’m facing unexpected edge-effects in a super simple 2D-Liquid-Flow simulation.
As you can see from the case attached, the 2D domain is 10 x 10 cm, 1mm structured grid, source term on the left edge, boundary condition on the right edge. The case should be very similar to the “H/sat_1D” benchmark and thus I expected a straight distribution from “some” pressure on the left to 0 Pa on the right side, but as you can see in the plot, the pressure distribution on the left side is not straight and on the right side the pressure drops to (almost) 0 about 0.9cm = 9 cells away from the boundary. Any ideas? OGS-Version 5.5.4
In case I get that running, I would like to model a heterogeneous sediment similar to the “H/HetGWFlow/2D” example. In this example, a permeability list is used. Is there a way to map these kind of lists from an ascii/excel/whatever file for more complicated geometries and unstructured meshes?
Finally, Is there a way to map boundary conditions from a file to a polyline or surface? If not, I guess “DIRECT” would work for me as well.
Best Regards!
Gerrit
–
You received this message because you are subscribed to the Google Groups “ogs-users” group.
To unsubscribe from this group and stop receiving emails from it, send an email to [email protected].
For more options, visit https://groups.google.com/d/optout.
Hi All
I noticed this effect in my simulations as well, and the issue doesn’t get addressed even when I use $EPSILON for the polylines. I have a small mesh 0.001*0.001 as well.
Is there something else that I might be missing?
—Reproducing gli file here as upload option is not available—
#POINTS
0 0.00000000 0.00000000 0.00000000 $MD 100 $NAME POINT0
1 0.1000000 0.00000000 0.00000000 $MD 100 $NAME POINT1
2 0.1000000 0.0500000 0.00000000 $MD 100 $NAME POINT2
3 0.00000000 0.0500000 0.00000000 $MD 100 $NAME POINT3
#POLYLINE
$NAME
PLY_BC_RIGHT
$TYPE
0
$POINTS
1
2
#POLYLINE
$NAME
PLY_BC_LEFT
$TYPE
0
$POINTS
0
3
#POLYLINE
$NAME
PLY_BC_TOP
$EPSILON
0.0001
$TYPE
0
$POINTS
3
2
#POLYLINE
$NAME
PLY_BC_BOT
$EPSILON
0.0001
$TYPE
0
$POINTS
0
1
#STOP
In terms you are not sure if all BC or ST nodes are found, please use $BOUNDARY_CONDITION_OUTPUT within the PCS file. This will create an ASCII-FIle which will list all found BC and ST nodes and the assigned values.
Thank you for the tip. I checked and the BC and ST nodes have been assigned the intended values. In a homogeneous domain with constant flow, I expect to see a gradient in the head changing uniformly along the direction of flow. So I have specified the boundary condition (head) at the “outlet” and a source term at the “inlet”. The farther I move from the “outlet”, the calculated head does not seem to follow this rule:
When I enforce the head as boundary condition at both “inlet” and “outlet”, this not a problem. What could be causing this issue?
Your $DIS_TYPE of your source terms seems to be CONSTANT,
Your $GEO_TYPE seems to be a Polyline, is that right?
If yes, then you simply do not distribute your inflow equally.
You can use CONSTANT_NEUMANN instead but take care the units
CONSTANT is m3/s and node-related
CONSTANT_NEUMANN is m/s and polyline-related.
Again, use $BOUNDARY_CONDITION_OUTPUT and compare the different node-related assignments. You will see that the values at the beginning and end of the polyline are half of the values beside them.
1 Like