Hi everyone
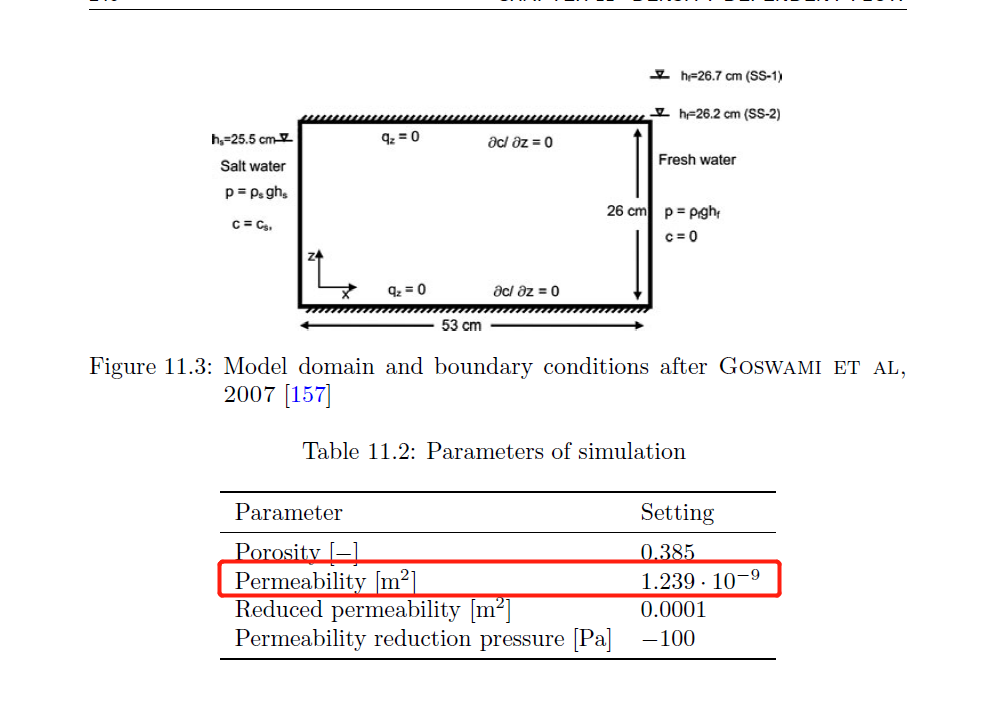
Recently I set up a model to simulate density-denpent flow model with ogs5.8.The numerical model is like the goswami problem in benchmark. For sensitivity analysis of the model, I changed the permeability and found that the shape and size of the salt water wedge did not change.This is not consistent with the conclusion in many papers, and then I also carried out sensitivity analysis on the permeability in goswami’s model, and found that the toe length and shape of the brine wedge also did not change. I don’t know what went wrong, but my guess is that the left and right boundaries are constant heads (i.e., the first type of boundary condition) in goswami’s model, I don’t know how to set up to perform sensitivity analysis successfully, Is anything wrong with Richard’s equation? Can you help me with this question? Thank you very much!
Thank you for any hint in advance
Hi hange1996,
can you please provide your input files such that I could have a look? Citations of the mentioned literature would also help.
Having set first type boundary conditions (Dirichlet) on both sides for pressure, I would not expect the shape to change as the pressure distribution (gradient) driving the advective flow does not change. From my understanding, a change in permeability should but result in a different flow velocity, which in turn has influence on the dispersion and fresh-saltwater transition zone. I am unsure if your changes were big enough (values) that you see this.
Best,
Marc
Hi @hange1996,
I can’t access the linked publication and cannot get the parameters from the experiment. Also, if I can’t see your setup, it is hard for me to tell what might be wrong. Could you try to use some cloud storage to provide your OGS setup?
Best,
Marc
Hi @marc.walther
I've compressed the input files into a directory and put the PDF version of the publication in it .You can download using the below link . Thank you for your advice and sincere help.
Link: https://pan.baidu.com/s/1HHg-iD3eflXApK5K-y2GqQ
Exaction code: 4w92
Best
hange1996
Thanks, @hange1996,
I can’t access, though, the linked file (can’t read chinese and don’t know what to click for downloading). Can you try to use something like dropbox, pCloud or something with an english interface?
Thanks,
Marc
PS: Please don’t put the pdf in the download, this is against copyrights. If you add a table with relevant parameters, this will suffice.
Hi,@marc.walther
This time i put all the input files and relevant parameters (screenshot) together and linked below with an english interface website.
https://c-t.work/s/86928a9725954f
Sincere
hange1996
Hi @hange1996,
I ran your setup and also changed permeability, but as you told, the interface is not changing. I truly would not see, why this should be the case anyways. Can you provide some more literature references where it is shown that the SWI interface changes with a different permeability in a setup like this? I would understand a variation of the SWI interface if one of the boundary conditions was a 2nd type BC.
Thanks,
Marc
Hi,@marc.walther
Check the following reference literature,the experimental setup is very similar to the previous one. Inland boundary and sea boundary are the first BC. But the aquifer stratification are took into account in his experimental setup. Results shows that the saltwater wedge shape and toe length are changing with different permeability of middle layer.
I did the numerical simulation with the same setup by ogs5.8,as i said before,when i change the permeability of middle layer with my ogs model,the interface is still the same.I really dont konw why,the simulation tool used in the two literature is seawat,Does it have to do with the tools we used ?
Lu C , Chen Y , Zhang C , et al. Steady-state freshwater–seawater mixing zone in stratified coastal aquifers[J]. Journal of Hydrology, 2013, 505(Complete):24-34.
Sincere
hange1996
Hi @hange1996,
thanks for the reference. Could you please provide the OGS setup files similarly as before?
Thanks,
Marc
Hi,@marc.walther
I’ve uploaded the setupfiles of that reference.What makes me confused is that no matter how i change the permeability of midde layer ,the shape keeps the same when the model runs enough time until the steady state of SWI. .From that reference you can see in author’s experiment results .The SWI interface changes with different layer pattern.SETUP.zip (2.8 MB)
Sincere
hange1996
Hi @hange1996,
I had a look at your setup and fixed several issues. I will describe this in the following.
-
You did not define any material groups (for OGS5 “MatGroups”) in your mesh. You have several options to do so.
a) Use GMSH and define several “Physical Surfaces”. You can find this option in the tutorials of GMSH: Gmsh 4.13.1
b) Use GINA, a pre- and postprocessor for OGS5 developed at BGR. The link can be found here: Introduction
c) Use the tool ResetPropertiesInPolygonalRegion to define materials from a given geometry in an existing mesh. Description of the tool here: Set Properties in Polygonal Region
Without any material groups defined in your mesh, any setting you take in .mmp does not show an effect unless you change the first property.
-
I firstly copied H.msh to H_v1.msh. Then, I adapted the example geometry file (here is the modified file: TestPolylines.zip (503 Bytes)) provided in the link from option c to define material groups “Bottom”, “Centre” and “Top” in your mesh with the following commands:
[PATH_TO_OGS6_RELEASE_DIR]/bin/ResetPropertiesInPolygonalRegion -m H_v1.msh -g TestPolylines.gml -r 0 -i 1 -o H_v2.msh -p Centre
[PATH_TO_OGS6_RELEASE_DIR]/bin/ResetPropertiesInPolygonalRegion -m H_v2.msh -g TestPolylines.gml -r 0 -i 2 -o H_v3.msh -p Top
(Please download the recent OGS6 tools here: Releases)
I then used H_v3.msh as H.msh for the simulation. NB: I only eyeballed the layer dimensions, so please adapt this to your needs.
-
I then also had to add two more material group definitions in the .msp file.
Finally, the ouput of the simulation is this:
You find the setup files here: HLH.zip (529.7 KB)
To summarize: you want to simulate a layered geometry, which due to different permeabilities leads to a deformation of the hydraulic gradient field and in turn to a different shape of the transition zone, but you did not define the layers in the mesh. Therefore, your OGS setup was only defined as a homogeneous setup and did not show any influence from the permeability as expected.
One final note: your initial request read
For sensitivity analysis of the model, I changed the permeability and found that the shape and size of the salt water wedge did not change.This is not consistent with the conclusion in many papers, and then I also carried out sensitivity analysis on the permeability in goswami’s model, and found that the toe length and shape of the brine wedge also did not change.
I am somewhat disappointed that initially, you did not quote the work you finally referenced (multiple layers causing a transformation of the transition zone), but say that there should be an influence on the shape due to different permeability of a homogeneous setup. We could have pointed out the solution much quicker if you had defined your problem clearly from the beginning on. I still could not find any of the “many papers” that show an influence from permeability in a homogeneous setup on the SWI shape.
All the best,
Marc
Hi,@marc.walther
I defined material groups by GINA. And it did work!! The SWI interface changes with different layer pattern. Your solution makes me realize that i have a lot to learn for better using ogs5.
I still have several questions:
1.I saw a h.pvd file in ur setup,Can u tell me its usage?
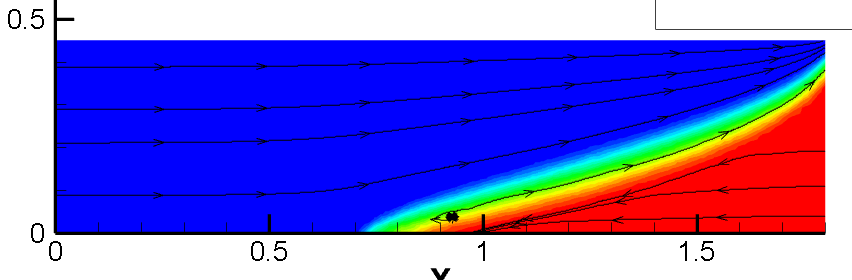
2.For post-processing i ususlly set TECPLOT as file output format,I can easily draw vectors or streamline in TECPLOT.I have tried PVD and VTK output format,but with paraview i can’t draw velocity vector or streamlines like the below pic,is there any thing wrong of my H.out file or can u tell how do u use paraview for plot streamlines?
Thanks again for ur detailed answer  You really do me a great favor!
Sincere
hange1996
Hi @hange1996,
the question is now off-topic, but here are some answers.
- A pvd file is just a collection of vtu files in a Paraview-readible format and proper time stamps. You can import a pvd simply in Paraview by loading the file.
- You can certainly draw streamlines and flow vectors with Paraview in a similar way (take a look at the filter CustomStreamtracer). See the Paraview manuals here https://www.paraview.org/paraview-guide/ and here https://www.paraview.org/Wiki/The_ParaView_Tutorial.
Best,
Marc