Hello,
I am currently performing simulations of a simplified geothermal doublet system consisting of a reservoir and a single fracture.
I am trying to investigate the effect of variations in the aperture/permeability of the fracture, however I am not sure if my implementation is correct because my results do not seem to make sense.
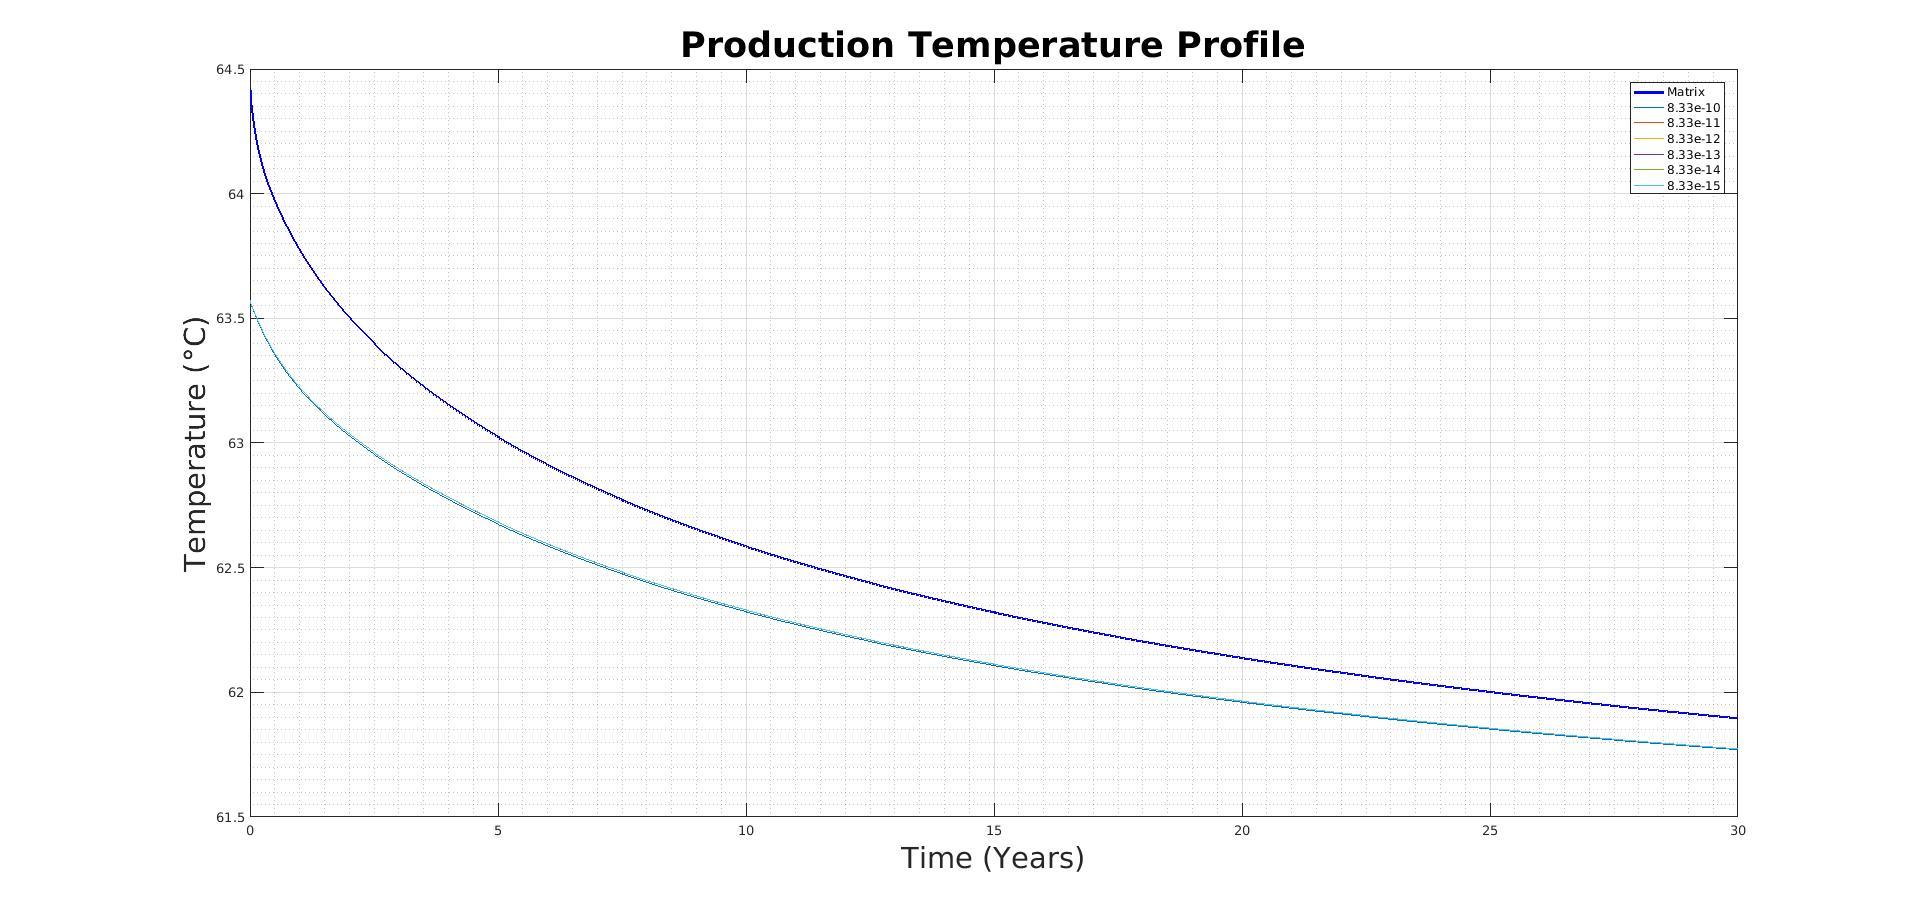
I ran one simulation with no fracture present as a base case. Then, using the relationship permeability, k = a^2/12 (where a is the hydraulic aperture), I ran simulations with 5 values for permeability and the corresponding aperture. I expected that as the fracture permeability decreases toward that of the matrix, the production temperature curves would also shift toward the base case of no fracture. All other variables were kept the same, however when I looked at the temperature curves, they all plotted on basically the same line.
I attached the plot. The matrix case is the dark blue line and all other values show very little variation although the permeability varies over 5 orders of magnitude. I also attached an example of one of the .mmp files because maybe there is something that I am missing.
Cheers,
Ariel
res4_pt3.mmp (638 Bytes)
···
From my understanding, the aperture of the fracture is set to $GEOMETRY_AREA in the .mmp file and the fracture permeability set to the keyword $PERMEABILITY_TENSOR.
Hi,
The .mmp file looks ok. Have you checked fluid velocity in the fracture while varying the permeability?
n
···
On 06/26/2016 09:10 PM, Ariel Thomas wrote:
Hello,
I am currently performing simulations of a simplified geothermal doublet
system consisting of a reservoir and a single fracture.
I am trying to investigate the effect of variations in the
aperture/permeability of the fracture, however I am not sure if my
implementation is correct because my results do not seem to make sense.
From my understanding, the aperture of the fracture is set to
$GEOMETRY_AREA in the .mmp file and the fracture permeability set to the
keyword $PERMEABILITY_TENSOR.
I ran one simulation with no fracture present as a base case. Then,
using the relationship permeability, k = a^2/12 (where a is the
hydraulic aperture), I ran simulations with 5 values for permeability
and the corresponding aperture. I expected that as the fracture
permeability decreases toward that of the matrix, the production
temperature curves would also shift toward the base case of no fracture.
All other variables were kept the same, however when I looked at the
temperature curves, they all plotted on basically the same line.
I attached the plot. The matrix case is the dark blue line and all other
values show very little variation although the permeability varies over
5 orders of magnitude. I also attached an example of one of the .mmp
files because maybe there is something that I am missing.
Cheers,
Ariel
--
You received this message because you are subscribed to the Google
Groups "ogs-users" group.
To unsubscribe from this group and stop receiving emails from it, send
an email to [email protected]
<mailto:[email protected]>.
For more options, visit https://groups.google.com/d/optout\.
--
Norihiro Watanabe, Dr.-Ing.
Department of Environmental Informatics (ENVINF)
Wissenschaftler
Helmholtz-Zentrum für Umweltforschung GmbH - UFZ
Helmholtz Centre for Environmental Research GmbH - UFZ
Permoserstraße 15 / 04318 Leipzig / Germany
[email protected] / http://www.ufz.de
Telefon +49 341 235 1806
Sitz der Gesellschaft: Leipzig
Registergericht: Amtsgericht Leipzig, Handelsregister Nr. B 4703
Vorsitzender des Aufsichtsrats: MinDirig Wilfried Kraus
Wissenschaftlicher Geschäftsführer: Prof. Dr. Georg Teutsch
Administrativer Geschäftsführer: Dr. Heike Graßmann
I did not check the velocities but I can …I only output the ELE velocities for the base case and for the others I was mainly interested in temperature. I tried to output the velocity at the monitor point as well but this output file returned no values.
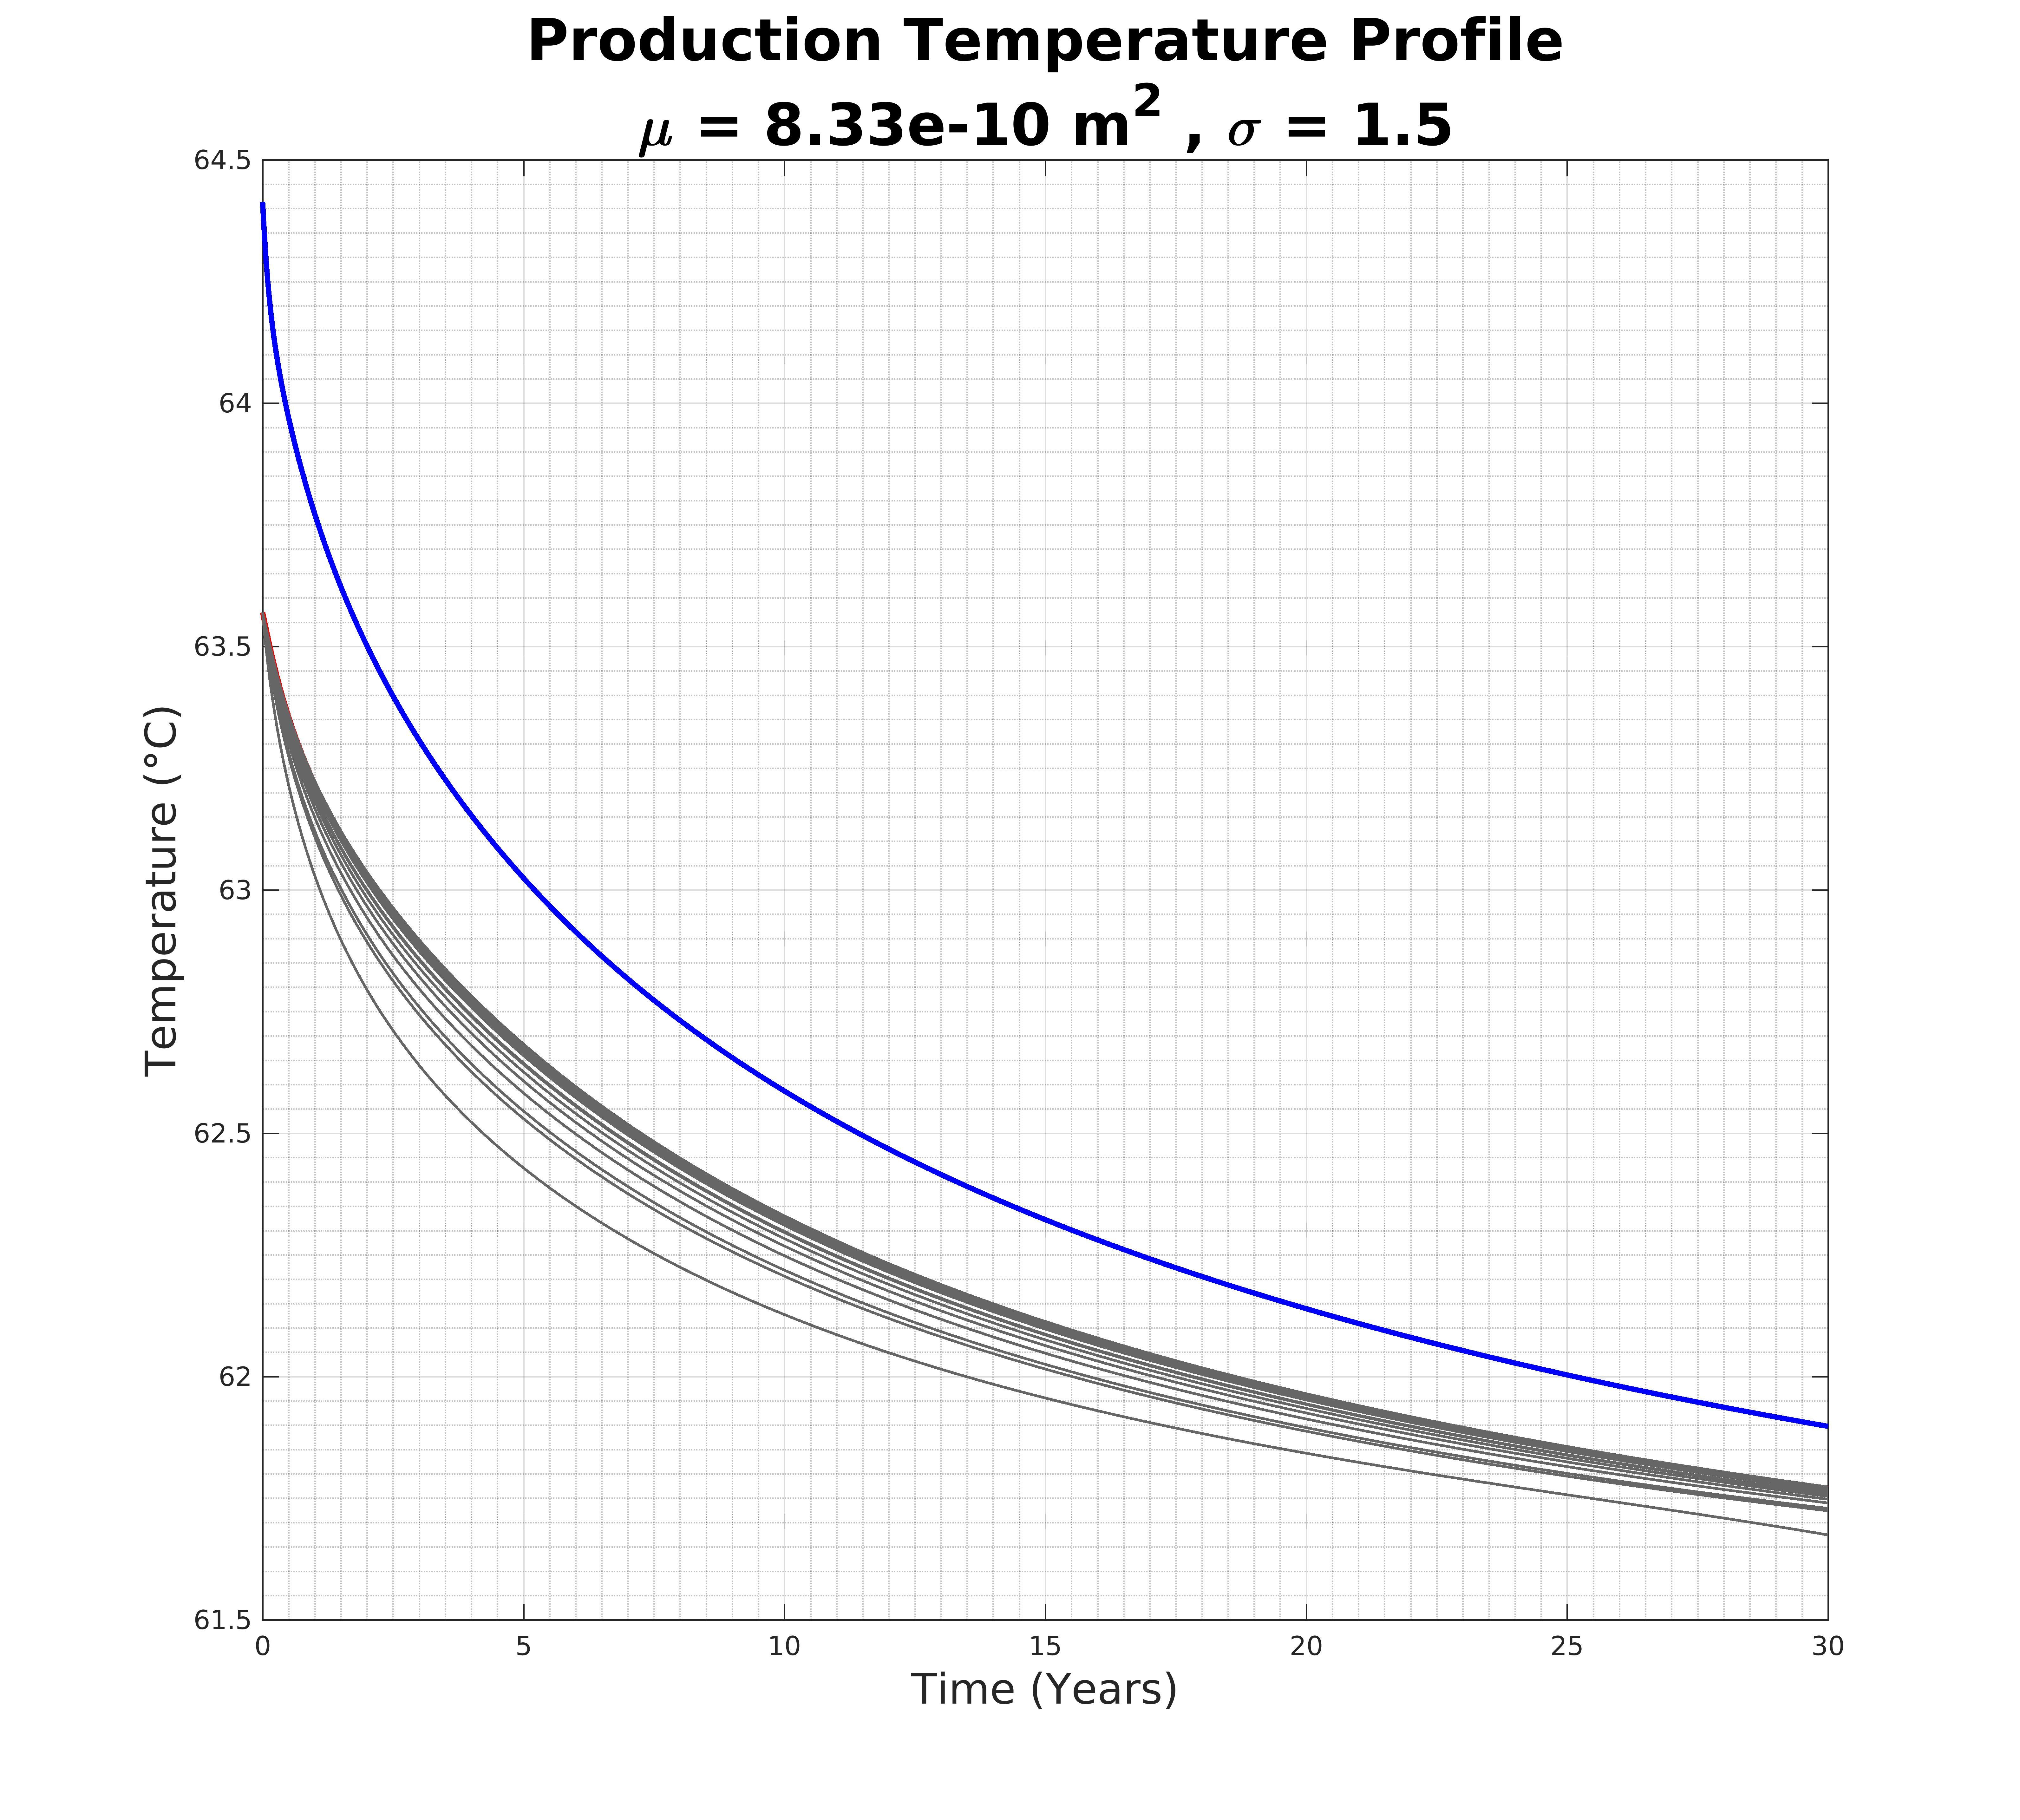
I performed similar test with high permeability. In this case I considered several values of permeability log normally distributed around the mean, 8.33e-10. I saw the expected variation in the production profile as can be seen in the attached plot…(blue line is the matrix case). However the same test for a mean of 8.33e-12 showed no spread. I ran around 50 simulations with varying values around the mean and they all plotted on the same line…
Is there some limiting case when the fracture permeability is too close to the medium permeability?
···
On Monday, June 27, 2016 at 8:03:51 AM UTC+2, Norihiro Watanabe wrote:
Hi,
The .mmp file looks ok. Have you checked fluid velocity in the fracture while varying the permeability?
n
On 06/26/2016 09:10 PM, Ariel Thomas wrote:
Hello,
I am currently performing simulations of a simplified geothermal doublet
system consisting of a reservoir and a single fracture.
I am trying to investigate the effect of variations in the
aperture/permeability of the fracture, however I am not sure if my
implementation is correct because my results do not seem to make sense.
From my understanding, the aperture of the fracture is set to
$GEOMETRY_AREA in the .mmp file and the fracture permeability set to the
keyword $PERMEABILITY_TENSOR.
I ran one simulation with no fracture present as a base case. Then,
using the relationship permeability, k = a^2/12 (where a is the
hydraulic aperture), I ran simulations with 5 values for permeability
and the corresponding aperture. I expected that as the fracture
permeability decreases toward that of the matrix, the production
temperature curves would also shift toward the base case of no fracture.
All other variables were kept the same, however when I looked at the
temperature curves, they all plotted on basically the same line.
I attached the plot. The matrix case is the dark blue line and all other
values show very little variation although the permeability varies over
5 orders of magnitude. I also attached an example of one of the .mmp
files because maybe there is something that I am missing.
Cheers,
Ariel
–
You received this message because you are subscribed to the Google
Groups “ogs-users” group.
To unsubscribe from this group and stop receiving emails from it, send
an email to [email protected]
mailto:[email protected].
For more options, visit https://groups.google.com/d/optout.
–
Norihiro Watanabe, Dr.-Ing.
Department of Environmental Informatics (ENVINF)
Wissenschaftler
Helmholtz-Zentrum für Umweltforschung GmbH - UFZ
Helmholtz Centre for Environmental Research GmbH - UFZ
Permoserstraße 15 / 04318 Leipzig / Germany
[email protected] / http://www.ufz.de
Telefon +49 341 235 1806
Sitz der Gesellschaft: Leipzig
Registergericht: Amtsgericht Leipzig, Handelsregister Nr. B 4703
Vorsitzender des Aufsichtsrats: MinDirig Wilfried Kraus
Wissenschaftlicher Geschäftsführer: Prof. Dr. Georg Teutsch
Administrativer Geschäftsführer: Dr. Heike Graßmann
Unfortunately the velocity output at particular points is not supported or not reliable in OGS. I normally calculate it from the element velocity using ParaView (extract only fracture elements and then apply "Cell data to point data" filter to get velocity in fractures).
Concerning the temperature breakthrough curve, you will see the fracture permeability influence on it only when heat transport is dominated by advection along the fracture. If flow velocity along the fracture is not sufficiently high, heat conduction in surrounding rocks becomes dominant and you will see no effects with varying the fracture permeability. Heat conduction gets more influence, e.g. when permeability in the fracture is not so high compared to the rock permeability, or the fracture aperture is too small, or thermal conductivity of the rock is high. So if you lower the rock permeability or the rock thermal conductivity, you should be able to see some variations even for a mean of 8.33e-12.
Best,
Nori
···
On 27/06/16 15:34, Ariel Thomas wrote:
I did not check the velocities but I can ..I only output the ELE
velocities for the base case and for the others I was mainly interested
in temperature. I tried to output the velocity at the monitor point as
well but this output file returned no values.
I performed similar test with high permeability. In this case I
considered several values of permeability log normally distributed
around the mean, 8.33e-10. I saw the expected variation in the
production profile as can be seen in the attached plot..(blue line is
the matrix case). However the same test for a mean of 8.33e-12 showed no
spread. I ran around 50 simulations with varying values around the mean
and they all plotted on the same line..
Is there some limiting case when the fracture permeability is too close
to the medium permeability?
On Monday, June 27, 2016 at 8:03:51 AM UTC+2, Norihiro Watanabe wrote:
Hi,
The .mmp file looks ok. Have you checked fluid velocity in the
fracture while varying the permeability?
n
On 06/26/2016 09:10 PM, Ariel Thomas wrote:
> Hello,
>
> I am currently performing simulations of a simplified geothermal
doublet
> system consisting of a reservoir and a single fracture.
>
> I am trying to investigate the effect of variations in the
> aperture/permeability of the fracture, however I am not sure if my
> implementation is correct because my results do not seem to make
sense.
>
> From my understanding, the aperture of the fracture is set to
> $GEOMETRY_AREA in the .mmp file and the fracture permeability set
to the
> keyword $PERMEABILITY_TENSOR.
>
> I ran one simulation with no fracture present as a base case. Then,
> using the relationship permeability, k = a^2/12 (where a is the
> hydraulic aperture), I ran simulations with 5 values for permeability
> and the corresponding aperture. I expected that as the fracture
> permeability decreases toward that of the matrix, the production
> temperature curves would also shift toward the base case of no
fracture.
> All other variables were kept the same, however when I looked
at the
> temperature curves, they all plotted on basically the same line.
>
> I attached the plot. The matrix case is the dark blue line and all
other
> values show very little variation although the permeability varies
over
> 5 orders of magnitude. I also attached an example of one of the .mmp
> files because maybe there is something that I am missing.
>
> Cheers,
> Ariel
>
> --
> You received this message because you are subscribed to the Google
> Groups "ogs-users" group.
> To unsubscribe from this group and stop receiving emails from it,
send
> an email to ogs-users+...@googlegroups.com <javascript:>
> <mailto:ogs-users+...@googlegroups.com <javascript:>>.
> For more options, visit https://groups.google.com/d/optout
<https://groups.google.com/d/optout>\.
--
Norihiro Watanabe, Dr.-Ing.
Department of Environmental Informatics (ENVINF)
Wissenschaftler
Helmholtz-Zentrum für Umweltforschung GmbH - UFZ
Helmholtz Centre for Environmental Research GmbH - UFZ
Permoserstraße 15 / 04318 Leipzig / Germany
norihiro...@ufz.de <javascript:> / http://www.ufz.de
Telefon +49 341 235 1806
Sitz der Gesellschaft: Leipzig
Registergericht: Amtsgericht Leipzig, Handelsregister Nr. B 4703
Vorsitzender des Aufsichtsrats: MinDirig Wilfried Kraus
Wissenschaftlicher Geschäftsführer: Prof. Dr. Georg Teutsch
Administrativer Geschäftsführer: Dr. Heike Graßmann
--
You received this message because you are subscribed to the Google
Groups "ogs-users" group.
To unsubscribe from this group and stop receiving emails from it, send
an email to [email protected]
<mailto:[email protected]>.
For more options, visit https://groups.google.com/d/optout\.
--
Norihiro Watanabe, Dr.-Ing.
Department of Environmental Informatics
Helmholtz-Zentrum für Umweltforschung GmbH - UFZ
Helmholtz Centre for Environmental Research GmbH - UFZ
Permoserstraße 15 / 04318 Leipzig / Germany
Telefon +49 341 235 1806
[email protected] / www.ufz.de
Sitz der Gesellschaft: Leipzig
Registergericht: Amtsgericht Leipzig, Handelsregister Nr. B 4703
Vorsitzender des Aufsichtsrats: MinDirig Wilfried Kraus
Wissenschaftlicher Geschäftsführer: Prof. Dr. Georg Teutsch
Administrativer Geschäftsführer: N.N.
Ahh yes that makes sense, I was thinking something along those lines but your articulated much better than I had it in my mind.
Thank you very much.
···
On Monday, June 27, 2016 at 5:47:44 PM UTC+2, Norihiro Watanabe wrote:
Unfortunately the velocity output at particular points is not supported
or not reliable in OGS. I normally calculate it from the element
velocity using ParaView (extract only fracture elements and then apply
“Cell data to point data” filter to get velocity in fractures).
Concerning the temperature breakthrough curve, you will see the fracture
permeability influence on it only when heat transport is dominated by
advection along the fracture. If flow velocity along the fracture is not
sufficiently high, heat conduction in surrounding rocks becomes dominant
and you will see no effects with varying the fracture permeability. Heat
conduction gets more influence, e.g. when permeability in the fracture
is not so high compared to the rock permeability, or the fracture
aperture is too small, or thermal conductivity of the rock is high. So
if you lower the rock permeability or the rock thermal conductivity, you
should be able to see some variations even for a mean of 8.33e-12.
Best,
Nori
On 27/06/16 15:34, Ariel Thomas wrote:
I did not check the velocities but I can …I only output the ELE
velocities for the base case and for the others I was mainly interested
in temperature. I tried to output the velocity at the monitor point as
well but this output file returned no values.
I performed similar test with high permeability. In this case I
considered several values of permeability log normally distributed
around the mean, 8.33e-10. I saw the expected variation in the
production profile as can be seen in the attached plot…(blue line is
the matrix case). However the same test for a mean of 8.33e-12 showed no
spread. I ran around 50 simulations with varying values around the mean
and they all plotted on the same line…
Is there some limiting case when the fracture permeability is too close
to the medium permeability?
On Monday, June 27, 2016 at 8:03:51 AM UTC+2, Norihiro Watanabe wrote:
Hi,

The .mmp file looks ok. Have you checked fluid velocity in the
fracture while varying the permeability?

n


On 06/26/2016 09:10 PM, Ariel Thomas wrote:
> Hello,
>
> I am currently performing simulations of a simplified geothermal
doublet
> system consisting of a reservoir and a single fracture.
>
> I am trying to investigate the effect of variations in the
> aperture/permeability of the fracture, however I am not sure if my
> implementation is correct because my results do not seem to make
sense.
>
>  From my understanding, the aperture of the fracture is set to
> $GEOMETRY_AREA in the .mmp file and the fracture permeability set
to the
> keyword $PERMEABILITY_TENSOR.
>
> I ran one simulation with no fracture present as a base case. Then,
> using the relationship permeability, k = a^2/12 (where a is the
> hydraulic aperture), I ran simulations with 5 values for permeability
> and the corresponding aperture. I expected that as the fracture
> permeability decreases toward that of the matrix, the production
> temperature curves would also shift toward the base case of no
fracture.
>    All other variables were kept the same, however when I looked
at the
> temperature curves, they all plotted on basically the same line.
>
> I attached the plot. The matrix case is the dark blue line and all
other
> values show very little variation although the permeability varies
over
> 5 orders of magnitude. I also attached an example of one of the .mmp
> files because maybe there is something that I am missing.
>
> Cheers,
> Ariel
>
> --
> You received this message because you are subscribed to the Google
> Groups "ogs-users" group.
> To unsubscribe from this group and stop receiving emails from it,
send
> an email to [email protected] <javascript:>
> <mailto:[email protected] <javascript:>>.
> For more options, visit [https://groups.google.com/d/optout](https://groups.google.com/d/optout)
<[https://groups.google.com/d/optout](https://groups.google.com/d/optout)>.

--
Norihiro Watanabe, Dr.-Ing.
Department of Environmental Informatics (ENVINF)
Wissenschaftler

Helmholtz-Zentrum für Umweltforschung GmbH - UFZ
Helmholtz Centre for Environmental Research GmbH - UFZ
Permoserstraße 15 / 04318 Leipzig / Germany

[email protected] <javascript:> / [http://www.ufz.de](http://www.ufz.de)
Telefon +49 341 235 1806

Sitz der Gesellschaft: Leipzig
Registergericht: Amtsgericht Leipzig, Handelsregister Nr. B 4703
Vorsitzender des Aufsichtsrats: MinDirig Wilfried Kraus
Wissenschaftlicher Geschäftsführer: Prof. Dr. Georg Teutsch
Administrativer Geschäftsführer: Dr. Heike Graßmann
–
You received this message because you are subscribed to the Google
Groups “ogs-users” group.
To unsubscribe from this group and stop receiving emails from it, send
an email to [email protected]
mailto:[email protected].
For more options, visit https://groups.google.com/d/optout.
–
Norihiro Watanabe, Dr.-Ing.
Department of Environmental Informatics
Helmholtz-Zentrum für Umweltforschung GmbH - UFZ
Helmholtz Centre for Environmental Research GmbH - UFZ
Permoserstraße 15 / 04318 Leipzig / Germany
Telefon +49 341 235 1806
[email protected] / www.ufz.de
Sitz der Gesellschaft: Leipzig
Registergericht: Amtsgericht Leipzig, Handelsregister Nr. B 4703
Vorsitzender des Aufsichtsrats: MinDirig Wilfried Kraus
Wissenschaftlicher Geschäftsführer: Prof. Dr. Georg Teutsch
Administrativer Geschäftsführer: N.N.