Hi everyone,
I have a few questions about Coaxial BHE simulation results in OpenGeoSys.
-
I assume that the temperature_BHE Z component stands for the temperature of the grout. Is that correct?
-
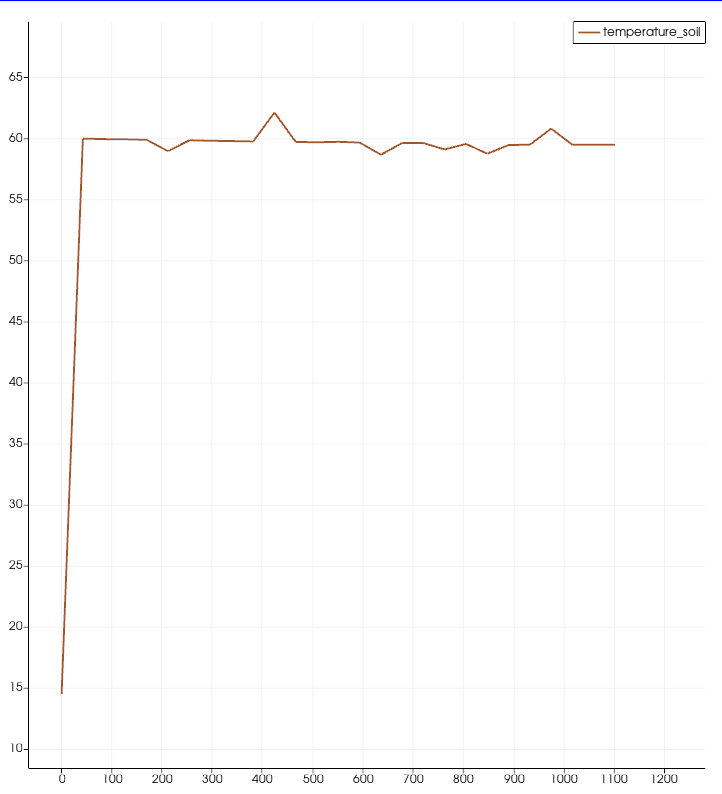
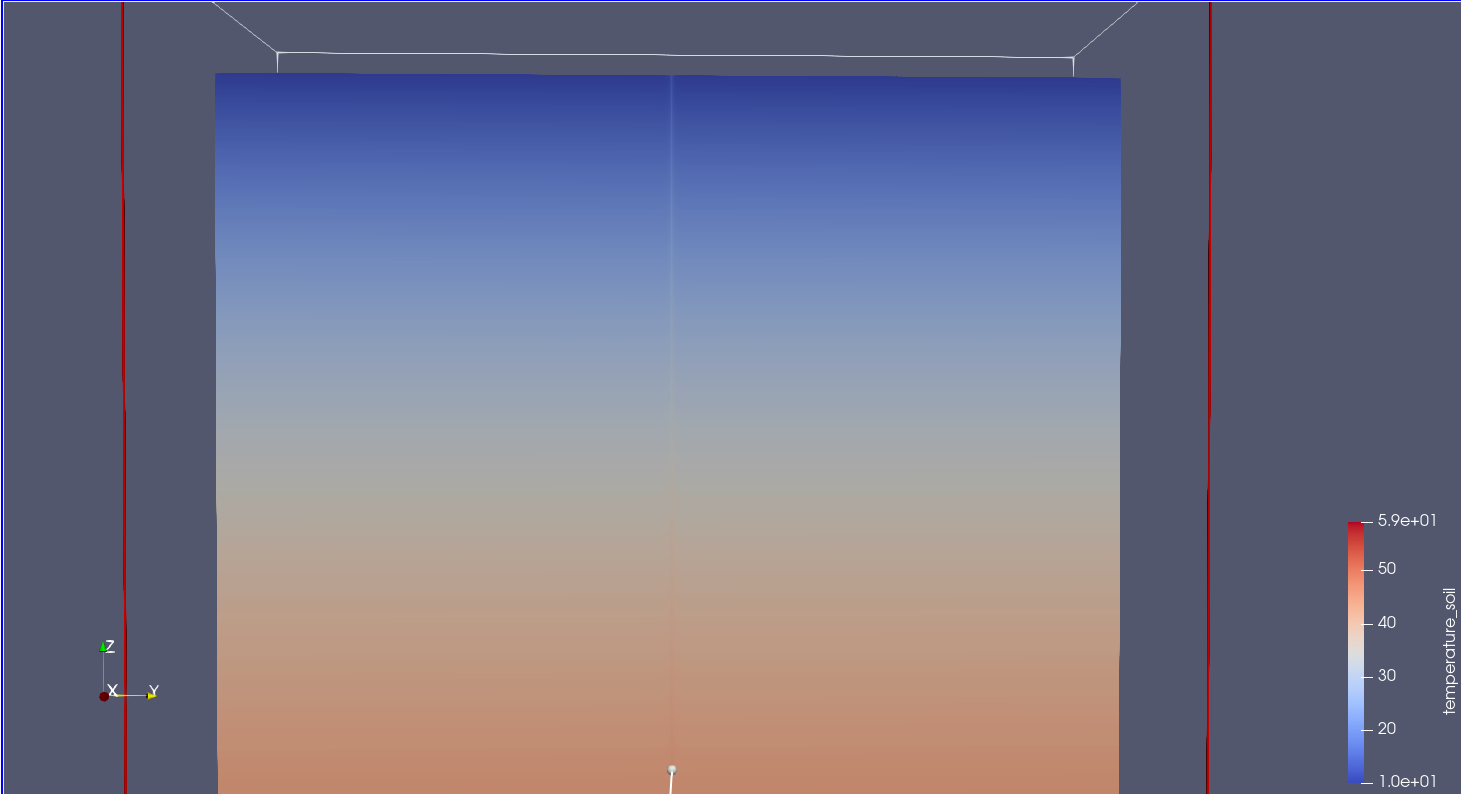
When I show the results of the soil temperature in ParaView at the last timestep, it appears to have have less temperature compared to when I get the results by extracting the data by “Plot over line” in ParaView. Why do I see it like that while the data shows that in the last timestep the soil temperature in the coordinate of the BHE is constant and around 60 degrees (Please see the images).
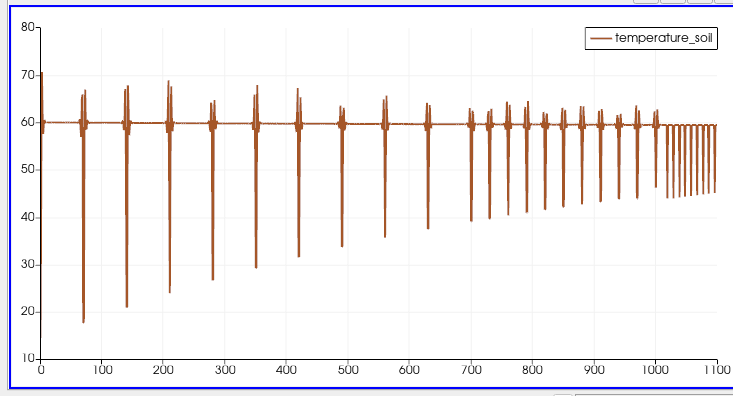
3.Why do I see wild fluctuations when I extract the soil temperature with high resolution (almost corresponding to the number of extruded layers in my mesh)?
Best regards,
Farid Arabameri
Dear Farid,
I’m not familiar with the BHE of CXC-type, but maybe I can help.
-
Yes, I think the third component of the BHE-vector should be the grout temperature according to the definition of the other types like the 1U.
-
The plot seems to be incorrect, please check it with some temperatures of mesh points (nodes), which are lying on your wanted line. The data of the plot must be consistent with the dataset. It’s a preview question, so I can not really help you.
-
Which line is represented by this plot? I’m not sure, what’s happen. I’m also wondering about the temperature of 60°C, which seems to be to high. Normally the temperature will also rise, with an increased depth. A geothermal gradient of 0.03 K/m is a good initial guess.
Maybe the tool VTU-Interface from Joerg Buchwald will help you, to investigate the simulation results more straightforward and get a comparison to the plots of paraview.
Good luck!
Best regards,
Max
1 Like