Thank you, here are my files.
BHE.zip (44.0 KB)
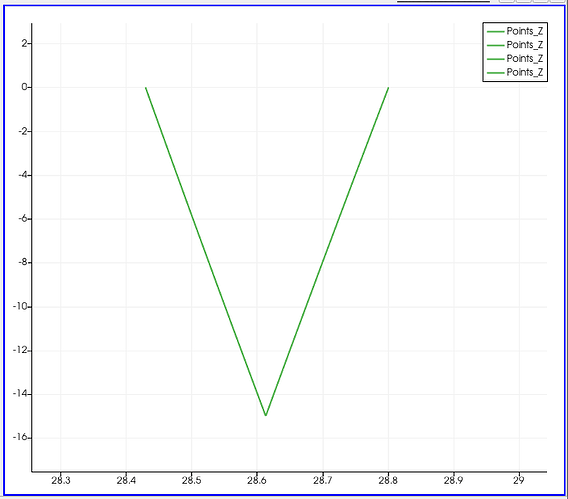
However, I found that the temperature change of the inlet pipe does not show a straight line (when no boundary conditions are set), but the model given in benchmarks shows a straight line, like this:
I look into your files and the definitions seems ok, but the time stepping can be problematic. Especially at the beginning smaller time steps are advantageous and your daily time steps are a good choice later on. I think a smaller timestepping for the first 3 days should be enough, start maybe with steps of 1h, than 6h, than 12h and finally you reach the daily time steps.
Good luck!
Hi @greyyaa,
Did you impose a very high groundwater velocity around the BHE? I saw the temperature distribution of the surrounding rock is not same between left and right of the BHE, that could generate some oscillation if the time step and element size is not suitable.
Best,
Chaofan
Hi,
Yes, I set up the flow of groundwater. I will adjust my time step and grid to see if the results can reduce the oscillation.
There will be a high-temperature area under the BHE pipe. Why is its temperature slightly higher than the surrounding soil temperature?
Best regards!
