Regarding the issue of BHE grid

Hi, all. I used the python tool provided in tutorials to build a grid model of BHE and implemented the example it provided. But when I changed the coordinates of the drilling, there was an error.

My bore coordinates are:
[[670,840,50],[605,885,50],
[645,865,50],[683,830,50],
[670,830,50],[620,883,50],
[620,867,50],[612,884,50],
[625,880,50],[615,870,50],
[652,858,50],[640,850,50],
[635,877,50],[678,837,50],
[663,848,50],[679,823,50]]

and set “mesh element size relaxing points”:
[[660,830,50],[680,830,50],[660,850,50],[680,850,50],[672,834,50],
[625,885,50],[651,864,50],[644,858,50],[612,883,50],[609,888,50],
[607,880,50],[616,886,50],[615,879,50],[646,850,50],[657,852,50],
[652,846,50],[671,848,50],[665,836,50],[676,830,50],[683,824,50],
[633,864,50],[620,877,50],[652,851,50],[627,871,50],[625,872,50]]

The approximate position of the final obtained point is as follows:
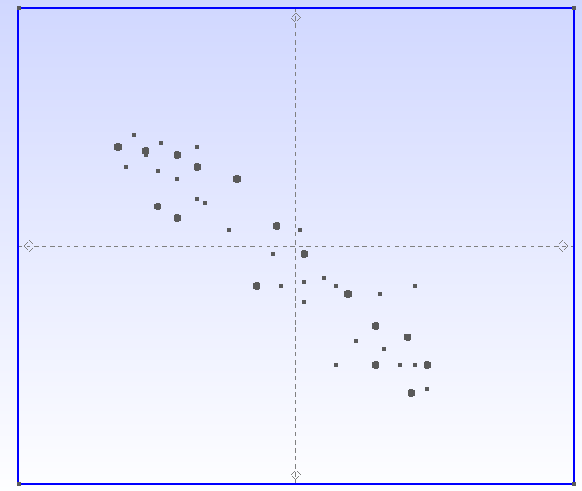
image

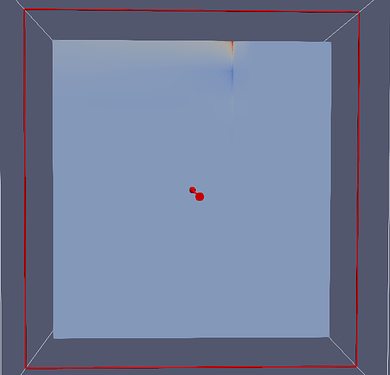
But the final result cannot display the complete BHE (This is just one of the BHEs):

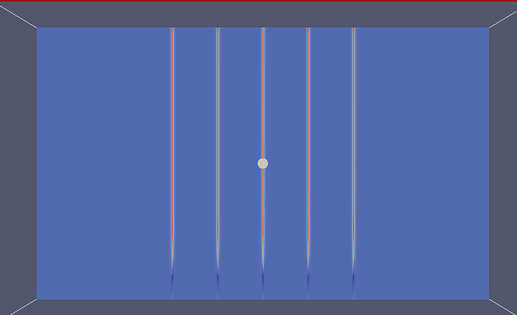
The correct result should be:

I have tried to change the number and coordinates of “mesh element size relaxing points”, but the results have not changed. Is it because the drill holes are too close together?

I also tried to set only one borehole in the model (my model size is 140 * 120 * 150), but still couldn’t display the complete BHE. However, after shrinking the model to 20 * 20 * 150, I was able to obtain normal results. So I think it’s due to the grid, but how can I modify my coordinates to get the correct result?
Hi greyyaa,

Could you please provide your script? It will help to identify the problem.

Best,
Haibing

Thank you very much for your help! This is my files.
BHEs.zip (682.2 KB)

Hi greyyaa,

I look into your meshing script and see, that your extruded BHE line elements did not have the same z-coords of your extruded 3D soil domain. At every BHE node there must be also a soil node, so you need to adjust the number of extrusion layers.
These simple modifications of your meshing file should work:

depth = 150
bhe_depth = depth - 50
R = gmsh.model.geo.extrude([(2, 1)], 0, 0, -depth, [15], [1], True)
G = gmsh.model.geo.extrude([(0, u)], 0, 0, -bhe_depth, [10], [1], True)

The ogstools package include a simple function, to generate ready to use BHE meshes for OGS simulations. Here you can find an easy example, how to use it: Creating a BHE mesh

Best,
Max

1 Like

I have modified the generated file of my grid according to your suggestion and solved this problem. Thank you very much!

Best regards!

Sorry to bother you, I have some questions about the BHE temperature setting. I found that in the .prj file, the initial conditions of BHE seem to have no impact on the result. However, in reality, the inflow temperature of circulating fluid in BHE will certainly affect the results. How should I set the inflow temperature of BHE?

Hi greyyaa,
in this section on the OGS-Website you can find more information about the Heat_Transport_BHE-Process. Concerning your question, every BHE has the <flow_and_temeperature_control> part in the prj, all possible options can be found on the above linked website.

Best regards!

Hi greyyaa,

We have to differentiate between two concepts.

  • Initial Condition of a BHE refers to the Tin, Tout, Tg1, Tg2 … temperature distributions along the entire length of a BHE at time = 0. This is only specifying the temperatures at the very beginning.
  • Inflow temperature of a BHE is actually a (hidden) boundary condition. Boundary conditions are regulated over the entire time domain. In OGS input file, it is not given under the ‘<boundary_condition>’ key word, but instead regulated by the <flow_and_temeperature_control>, as mentioned by Max. You will find detailed descriptions on different types of controls on that webpage.

I think what confuses you is the name T_in and T_out. They refer to the temperatures at the inlet and outlet pipe inside a BHE, so these values actually extends along the entire BHE. Eventually, only the T_in value at the top of the BHE is controlled, the rest are dynamically calculated by the simulation.

Best,
Haibing

Hi Max,
Thank you very much for your reply! I have found the parameters I need in the section.

Best regards!

Hi Haibing,
Thank you for your detailed reply to let me know more about this part.

Best regards!

Hi, I have a new question to ask.The BHE in the example of ogs is represented by a straight line. Can the u-shaped tube be displayed in the model (1u or 2u type)? Because I want to see the temperature distribution in the u-shaped tube in the results.

Best regard!

Hi greyyaa,

The 1U, 2U, CXA, CXC and 1P type of BHEs are already included in the current OGS model, but they all look like straight lines. This is because the BHE line elements share the same nodes used by the soil prism elements. Only additional continuum are added on those line elements during the simulation.

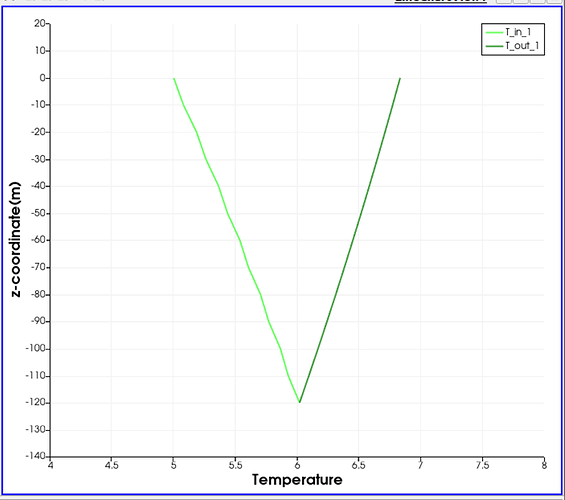
What you probably want to ask is how to plot a similar figure as Figure 2 in the 2U BHE benchmark. This can be achieved in Paraview. After loading the VTU file into Paraview, you add a filter called “plot over line”. Make sure the start and end points of your line are the same as the BHE. With this filter the T_s, T_in, T_out, T_g1 and T_g2 values will be gathered. You can then play with the 2D plot settings in Paraview or export them for further visualizaiton treatment.

This youtube video explains how to use a plot over line filter in Paraview. Try to play with the benchmark output files in Paraview. You should be able to figure it out by following the above tutorial.

Have fun.
Haibing

Hi Haibing,
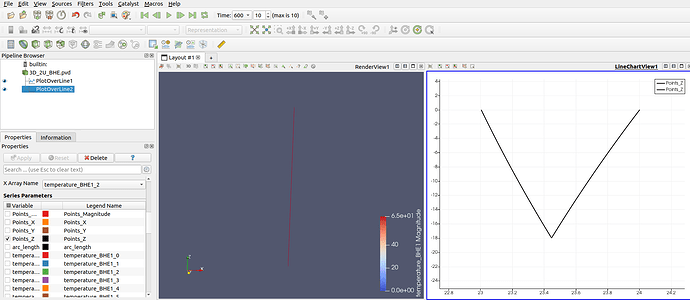
I ran the example of 3D_2U_BHE and attempted to generate the result shown in Figure 2 in Paraview. I set the positions of two points:
image
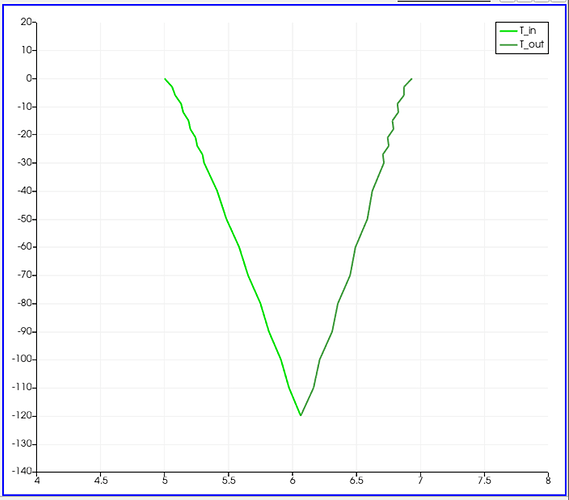
And then I obtained a series of data, where the temperature_BHE1_0 to temperature_BHE1_7 refer to the data of T_in, T_out, T_g1, and T_g2? But I’m not sure which data they respectively refer to, and I put two of them together and got this graph. I don’t know if it’s the correct result.

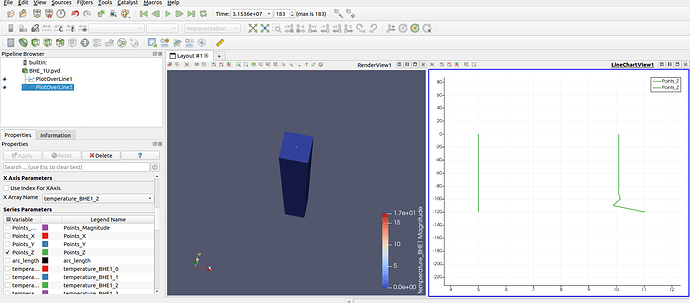
But the results I obtained in my own model were quite strange,I get the figure:

here is my file:
BHE.zip (30.5 KB)
And what parameter does the temperature_BHE1_Magnitude refer to?

Best regards!

Hi greyyaa,

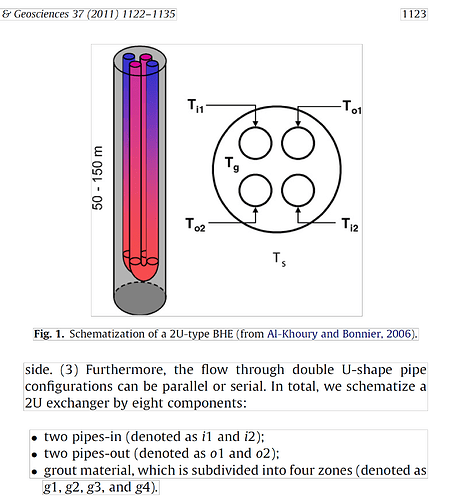
The 3D_2U_BHE example has a BHE of 2U type. This means, it has 4 pipes in the borehole. In this case, the primary variables extend to 8 temperatures. They are T_in_1, T_out_1, T_in_2, T_out_2, T_g_1, T_g_2, T_g_3, and T_g_4. The T_gs are the temperature of grout surrounding each pipe. You will find detailed description of the numerical model in Diersch 2011a (doi:10.1016/j.cageo.2010.08.003).

The Magnitude is very useful for a Vector. The magnitude of a vector A is the length of the vector A and is denoted by |A|. Put into layman’s language, it’s about how big a vector is. Here Paraview is treating the Temperature_BHEs as vectors, each with multiple components. This is not the case in our model.
For real vectors like v_x, v_y, and v_z, you need the Magnitude to reflect the length.

Best,
Haibing

So I shouldn’t look at the value of BHE’s magnitude. When I observe the temperature of the liquid in the BHE pipe, I should look at the value of T_in and T_out, right?

The magnitude of this vector is not meaningful, so you’re right with looking at T_in and T_out values. For the 2U BHE the order is as follows {T_in1, T_in2, T_out1, T_out2, T_g1, T_g2, T_g3, T_g4}

Thanks, I now know how to view the BHE results.
Do you know how to set the atmospheric temperature on the ground? I think there seems to be some errors in setting the top surface temperature of the model directly.

Best regards!

I think you want to set a Dirichlet BC for the temperature_soil at the top surface. If the BHE starts at the top surface, this can be numerically difficult - you’re right. I see two options: Let the BHE start at a depth of eg. -1m or cut of an area of the top surface around the BHEs. Cutting the top surface should be possible with ParaView or other external tools like PyVista or so on. In general it seems easier to change the BHE beginning depth.

Good luck!

Hi, I have tried both methods and I think it is more appropriate to extract the top surface mesh and then set the temperature boundary condition on the top surface. However, the result curve I get has a very obvious folded line, and the temperature change of the inlet pipe is not in a straight line, there are some fluctuations, why is this?
This is the result without adding the temperature boundary condition:


This is the result of adding the temperature boundary condition:

I also observed a high temperature spot at the bottom of the BHE tube, is it because of heat accumulation or because of meshing?(You can see the red part at the bottom of the BHE)

Best regards!

Hi,
can you upload the mesh and prj-file, so that I can take a closer look into the setup? Currently I think, you specified the soil_temperature at the top also at the BHE node (I think an area with no boundary condition for the temperature soil in near of the BHE is necessary) - then the BHE is greatly influenced at the inflow by the Dirichlet BC and this unreliable results occur.

Personally I let the BHE start at a depth of -1m, if I set a Dirichlet BC at the top surface for temperature_soil - than the results looks good in my tested cases.