Hello everyone,
I am learning OGS6; I have a few queries and difficulties.
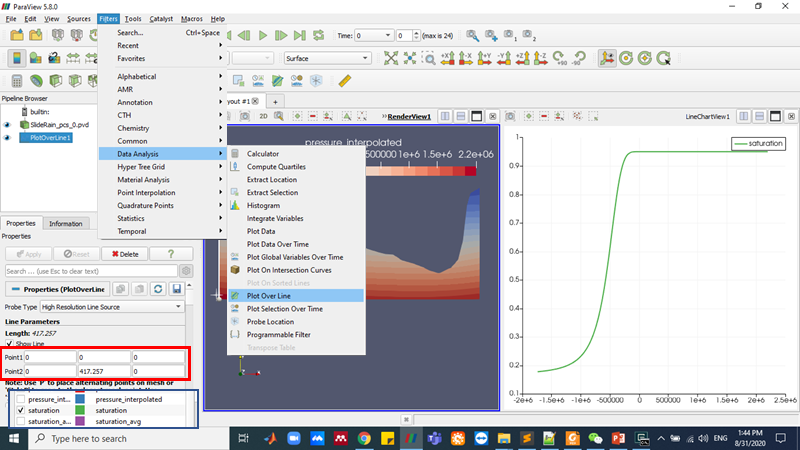
1. Wrong Result from seepage simulation.
I am simulating seepage (Rainfall seepage) with the existing regional groundwater table. I have generated Initial Condition (equilibrated regional groundwater table) by running gravity steps for a 100 years time period. Now, I am implementing the Rainfall seepage by mass flux through the top by specifying a Neumann boundary condition. I have applied the rainfall intensity of 420mm for 16 hours (7.292 x 10^3 kg/m2/sec).
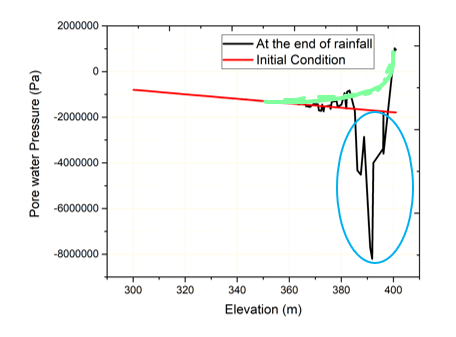
But I am getting some high negative pressure pockets larger than the initial condition. As you can see in the following figure; the curve inside the blue circle is unwanted and the expected curve is the green line shown in the same figure.
What do you think causes this problem?? My professor told me time-stepping could be the culprit. I have used delt-t equal to 1 and 0.5 seconds, but still; I am getting a similar result.
2. Related to VanGenuchten Saturation Curve
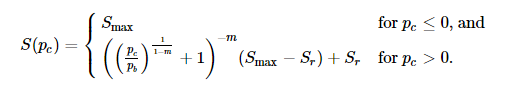
The source code Documentation says that saturation is computed from the capillary pressure as follows:
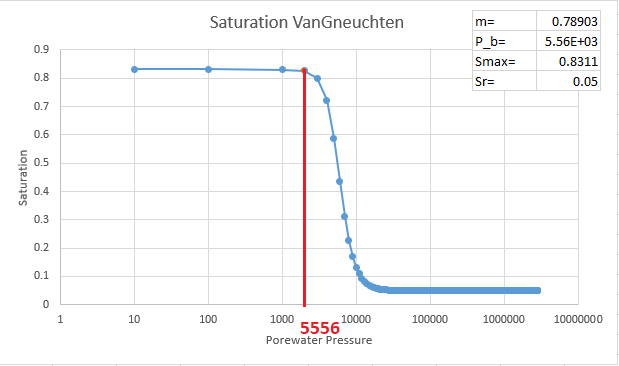
I have plotted this graph with excel and I got this (pore water pressure shown in the following graph are negative suction pressure).
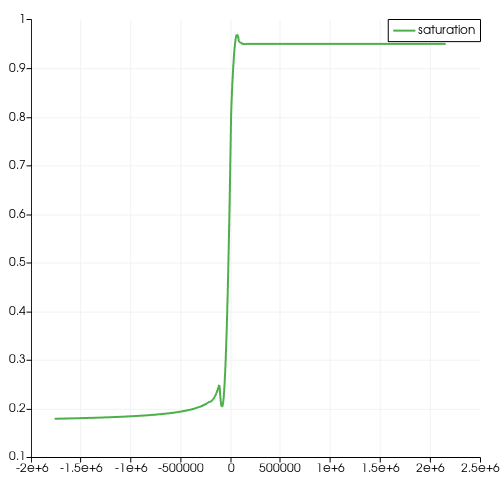
But when I plot the result obtained from OGS with the same parameter I got this.
Is this a bug or something I did wrong so I got this result?
Thank you for your support,
Regards,
Laxman Kafle
Input Files:2_RainfallSim.zip (4.3 MB)
Otherwise such errors, I agree, can be related to the time step size to mesh element size relation. Try adaptive time stepping.
If you are not sure about the OGS’s implementation of the pressure-saturation relationship, setup a small (single element) test where the boundary condition for pressure is applied on all nodes and varies over time from unsaturated to fully saturated. Displacement is zero for all nodes. But we have done such tests; also see unit test Tests/MaterialLib/TestMPLSaturationVanGenuchten.cpp · master · ogs / ogs · GitLab. There you can easily add output of pressure and saturation and plot it.
Now, the result of the simulation looks good. Thank you for your help.
Furthermore, I am wondering is there is an option to define the seepage face boundary condition as described in this paper (especially dynamic seepage boundary condition)?
This seapage BC would be nice addition to OGS, indeed!
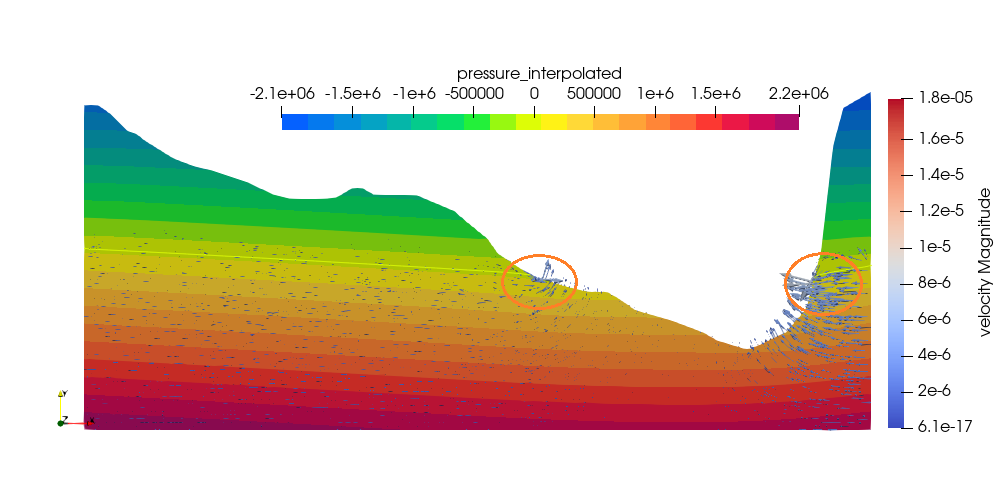
Regarding the simulation, I’d recommend to refine the mesh where the pressure gradients are high; there are few such spots near the top boundary, at least in my simulation results.
I could not reproduce the “toothed” saturation plot with results I got locally.
Did you use mass-lumping, or did you change anything else to get the results?
Thank you for your reply,
Seepage BC would be very useful for accurately simulating the groundwater table (especially as it will improve the results on the red-circled part in the following figure.) and in many more situations in groundwater simulation. I am especially interested because I want to simulate the drawdown of the reservoir.
Regarding the simulation, I have refined the mesh little bit, used mass-lumping and changed some parameters. Here are the new input files: Rainfall.zip (6.1 MB)
I guess the toothed saturation plot was due to the extrapolation errors as you mentioned earlier. (I got those kinds of the toothed plot when I use a small p_b).