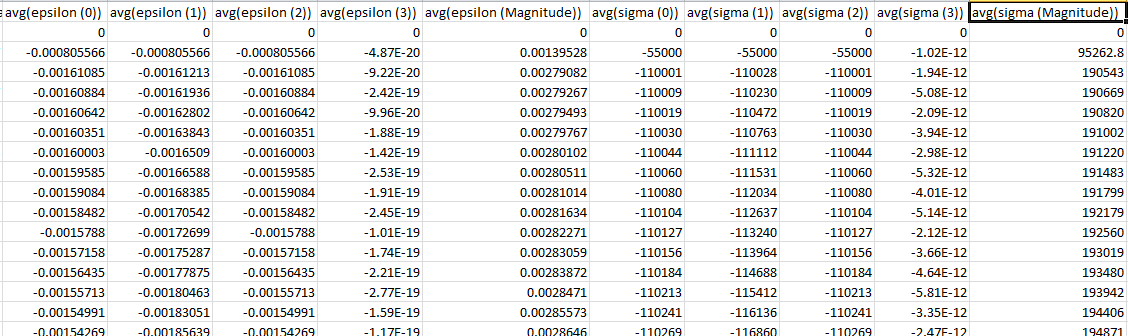
I have performed a triaxial drained test using MFront’s Modified Cam Clay model. As I want to plot stress vs strain, I extracted a spreadsheet from ParaView using the PlotDataOverTime filter. However, I could see several types of stresses {avg(sigma(0)), avg(sigma(1)), avg(sigma(2)), avg(sigma(3)) and avg(sigma(Magnitude))}. The same parameters were observed in terms of strains.
I would like to know what kind of averages these are and what the difference is between avg(sigma(0,1,2,3)) and avg(sigma(Magnitude)).
I am attaching one of the screenshot for your reference.
The “magnitude” is (most likely) the Euclidean norm of the sigma vector, i.e., sqrt(sum(entries^2)). You might want to double-check with the ParaView documentation to be 100% sure.
But what does that average signify when we use the PlotDataOverTime filter in ParaView? Is this a surface average in 2D and a volumetric average in 3D/ axisymmetric?
I’d assume it’s an arithmetic mean of point/cell data of your selection. I don’t think that it involves any integrals, probably just plain arithmetic mean. But it’s only an assumption.
The average is the euclidean norm of the entry components in a symmetric tensor as discussed above by @chleh. However, this average is calculated at a particular point/ cell that you chose, if it is ‘plotDataOverTime’.
However, you can check one of my earlier discussion post made on the procedure to select a point for plotting in ParaView.